One strong day in the market doesn’t make a trend… but at the very least, two days make a streak.
As an index momentum trader I thrive in market conditions like the one we find ourselves in.
But one thing you want to be careful about is blindly buying the SPY’s just because the market is up or down for the day.
This is known as “chasing the price”, and can be one of the most detrimental trading mistakes any trader can make!
Bad timing can destroy a perfectly good strategy.
That’s why I’m going to spend some time with you today explaining the indicators I use to better time my entries and exits.
It’s the same approach I used to knock down 20 out of 22 SPY trades last month, and one that I believe can be a difference-maker for your trading too.
Table of Contents
Market Timing Indicators
At the core of Daily Deposits are market timing indicators and these indicators are being used to identify perfect reversal levels in the SPY’s.
That’s exactly what I’ve been using to time the markets – Winning over 90% of all my trades in times of high volatility.
How did I do this?
By using a Bollinger band market timing indicator.
The Basics
Bollinger Bands were developed by John Bollinger as a price envelope designed to define the upper and lower price range levels of a stock.
For anyone who is unfamiliar with Bollinger Bands here is some background information to learn how this indicator can help you time the markets with superior accuracy.
Bollinger Band Indicator consists of a middle SMA along with an upper and lower offset band. Because the distance between the bands is based on statistics, such as a standard deviation, they adjust to volatility swings in the underlying price.
How do you read them?
Bollinger Bands help to determine whether prices are high or low on a relative basis, and according to these calculations, price should fall within range 95% of the time!
Typically, prices should fall inside the bollinger band values…But sometimes it goes outside of them and gets it smap in.
How this indicator works:
- When Bollinger Bands tighten, there is a high likelihood that price will have a sharp move
- When the bands separate by an unusually large amount, this is showing a significant increase in movement
- Prices can exceed and even hug or ride a bands prices for extended periods of time.
- Price has the tendency to bounce within the bands’ envelope, touching one band and moving back towards the other.
- You can use the middle SMA or opposite band as target prices and exits for your trading
- If prices move outside of the band, it’s expected to see a trend reversal
Let’s take a look at an example chart:
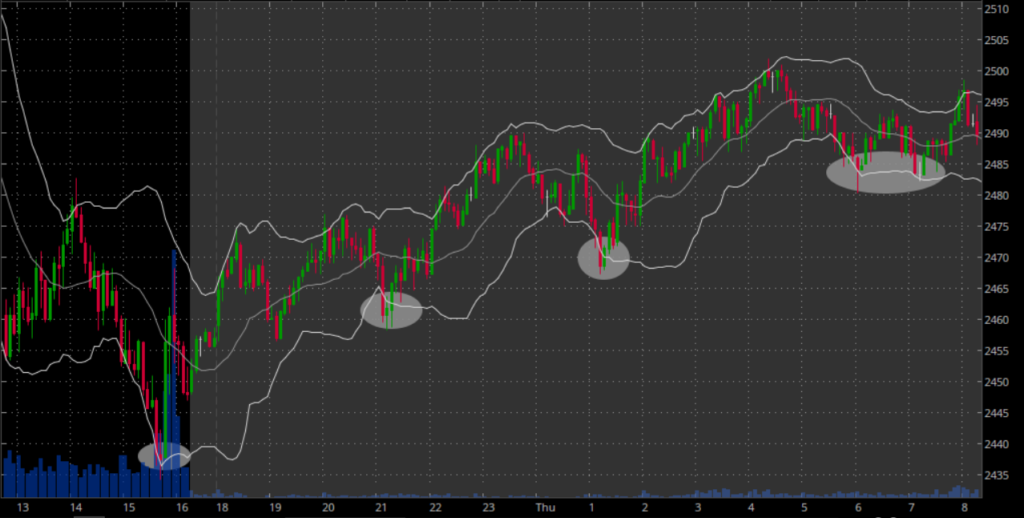
Source:Thinkorswim
Here you can see exactly how the Bollinger Band restricted the prices to remain inside the bands.
In a quick glance…
The trader will see:
- Stock “bounces” off lower band
- Stock trends higher, in a staircase pattern
- Trader can buy at and dip into band
The Trade
Let’s take a look at the same chart but look at how to apply it to a breakout shortly after the market opens.
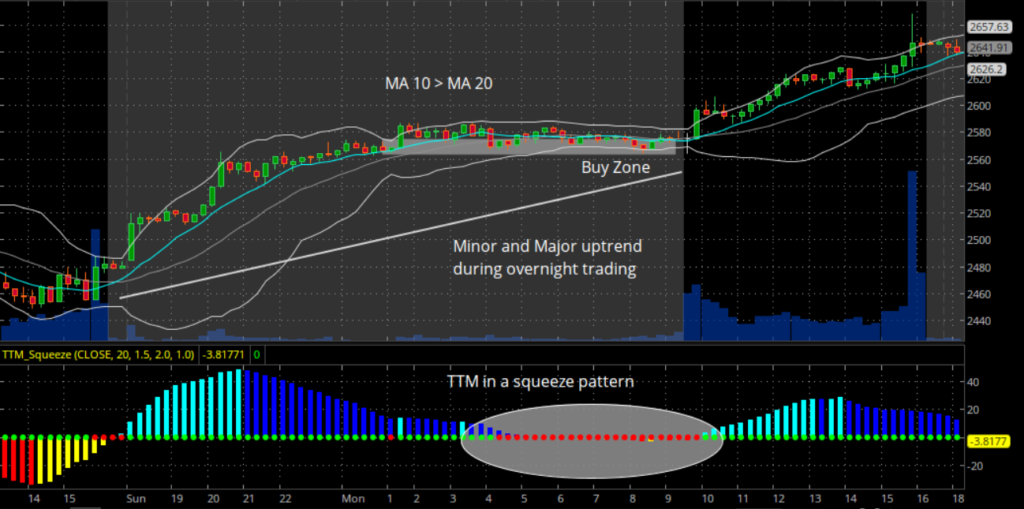
Source: Thinkorswim
The trade setup:
- 10MA > 20MA in premarket
- Minor and major trendline pointing to higher prices
- Bollinger Bands narrowed and created a Squeeze pattern before the open
- Price consolidated at a Buy Zone based off of premarket support levels
- Price fell into the lower Bollinger Band, the technical support level
Once I analyze the premarket momentum I determine what direction I want to trade the markets and lay out what my stops are going to be in advance.
Here’s what members of Daily Deposits had alerted in the premarket trading session.
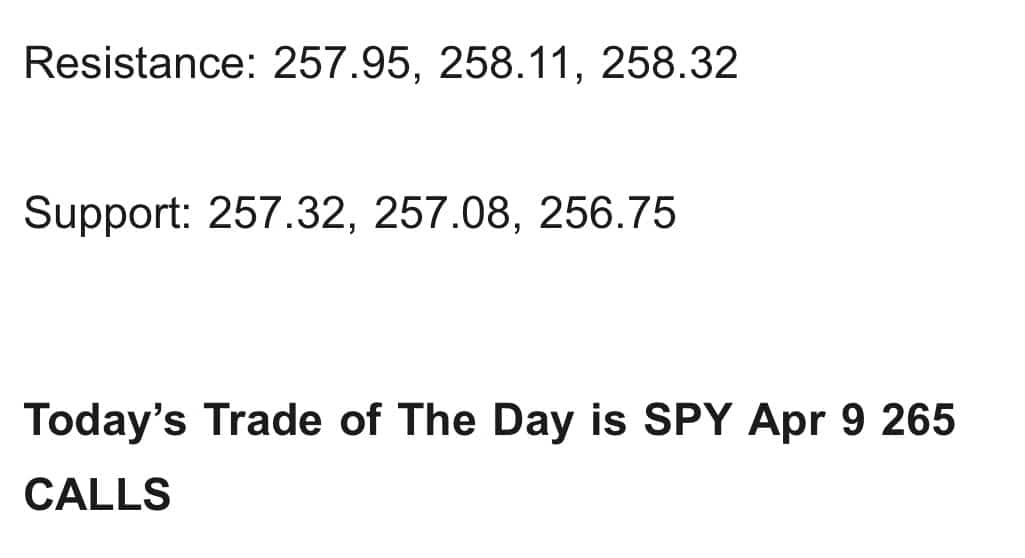
This is the alert my premium members received that outlined exactly where support and resistance was on the SPY.
What Happened
Right after the alert and signaled entry, the market took off higher the entire day.
At the time of the signal, the contracts were being sold at $1.51
And the SPY broke out from its consolation and rallied strong into the close.
Just take a look at options explode in value:
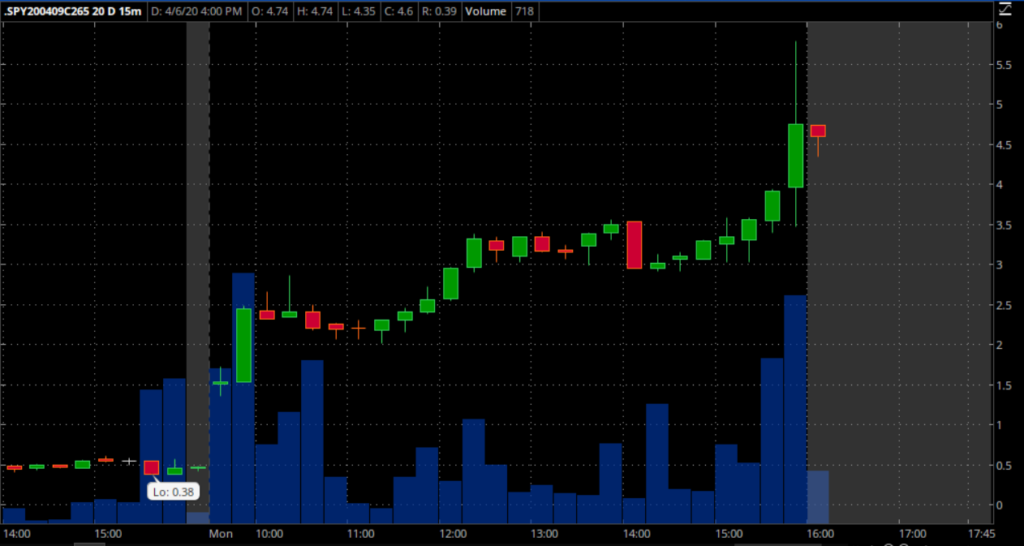
Source: Thinkorswim
And if you were to time the entry and exits perfectly, you could have pulled down a whopping 335% ROI on this trade!
Wrapping up
There are some key takeaways from the trade that made it possible in the first place.
It’s important to remember that a single indicator cannot predict the markets! You need to put the entire picture together using many technical analysis techniques.
Click here to learn how I use technical analysis beyond those indicators to predict huge market moves.
By combining multiple indicators it lets you create extremely strong trading signals. This lets you tap deep into the inner-workings of a stock and hack the direction of the trade.
And when it comes to the TTM Squeeze and Bollinger Bands, you can get yourself on the right side of the trade more often than not.
Here is a recap of the momentum strategy
- Premarket support or resistance levels to know where to set stops and look for trades.
- TTM squeeze to know when stocks are “coiled up” and ready to move when volatility picks up.
- Bollinger Bands act as key levels of support or resistance for a stock.
- Place orders at Bollinger Bands levels since the bands.