Markets got its first taste of volatility yesterday, as geopolitical tensions rise following a U.S. airstrike in Baghdad killed five members of Iran-back militia, including General Soleimani.
Putting politics to the side, the spike in volatility was welcomed by most option sellers like myself—which should open a lot of opportunities in the coming weeks.
But today, I want to talk to you about something else important.
Last week, I said goodbye to 2019 by booking a $5K winner on Alibaba (BABA) in less than three trading sessions!
There were several things that clued me in on BABA’s potential pullback…
To start, the stock was highly overbought after a big run higher, and seemed stretched thin.
But what I’d like to discuss today is how the security’s VOLUME played into my decision to put on a bearish spread… and how you can use various indicators to aid your trading.
Why is it so important?
Because a lot of stocks right now are experiencing a similar pattern.
What Volume Can Tell Us
Volume, in a nutshell, is the number of shares traded during a certain time frame.
It can help you gauge general market enthusiasm and/or demand for a particular stock, fund, or another trading vehicle.
Not only that, but volume trends can serve as alarms for short-term tops and bottoms, reversals, exhaustions, and more.
It is generally thought that a rising stock market or individual stock should see rising volume.
When a stock makes a strong move higher on weak volume, the uptrend is often viewed as suspect and suggests the stock is vulnerable to a turn lower.
This is because declining volume indicates demand for the stock is waning, leaving fewer buyers on the sidelines to push the shares even higher.
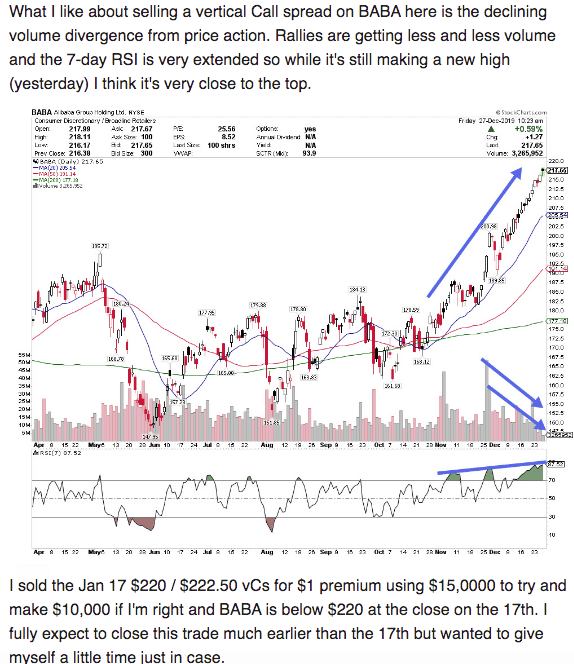
That said, here’s what I sent my paid Weekly Windfalls subscribers regarding the aforementioned BABA trade on Friday, Dec. 27:
As I said, BABA shares were notably overbought, and the breakout was accompanied by relatively weak volume, suggesting a short-term top could be coming — before the $220 level (my sold call strike).
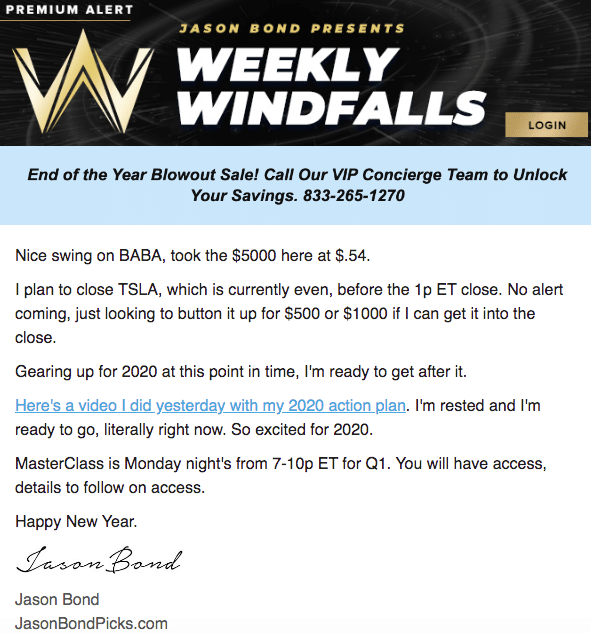
Thankfully, BABA shares did, in fact, stall for a while, and on Tuesday, Dec. 31, I was able to close out of the trade with a $5,000 gain, capturing about 50% of the maximum profit potential!
And, as you can see on the correspondence above, my brand-new 12-week MasterClass will kick off later this month. I’ll answer common questions about options trading, technical analysis, and more — and the best part is, the first session is practically free to all paid Weekly Windfalls subscribers! Upgrade now before it’s too late.
3 Volume Indicators for Your Trading Arsenal
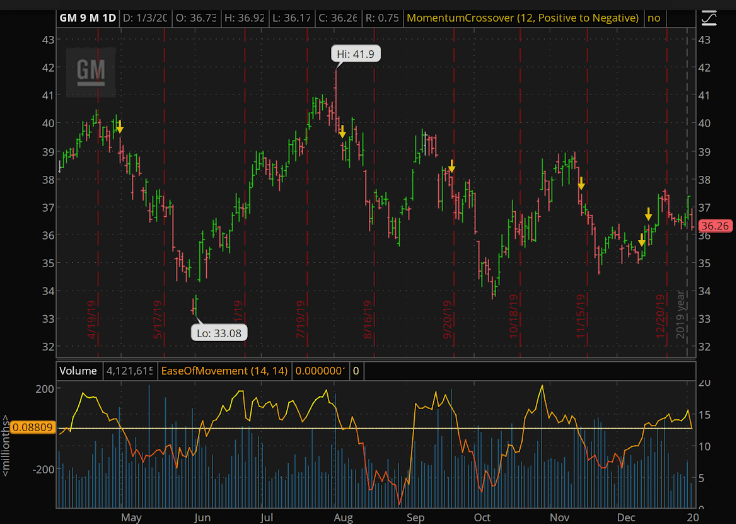
One volume indicator that some traders use is Ease of Movement (EoM), which quantifies the relationship between a stock’s volume and price change.
I won’t get into the nitty-gritty on how EoM is calculated, but it’s generally considered a buy signal when the EoM plot moves above zero, and a sell signal when the EoM crosses below zero.
Take a look at this chart of General Motors (GM) stock over the past year.
The yellow arrows on the top chart point to notable rollovers of the EoM, which is illustrated on the bottom chart.
Back in April, the EoM moved below zero, and preceded a nasty sell-off to GM’s June low of $33.08.
Shortly after that low, the EoM crossed back above zero, preceding a bounce-back into GM’s August high of $41.90.
More recently, crosses below zero preceded pullbacks for GM in September and November.
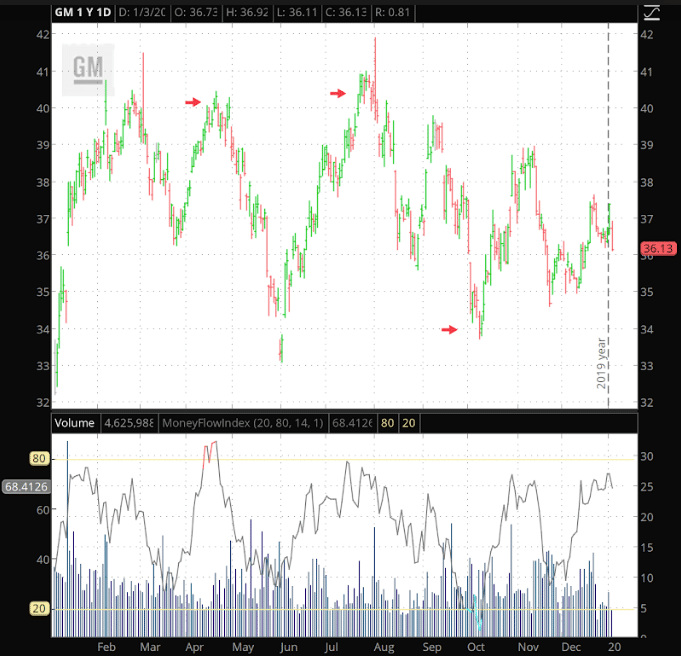
Another volume-based indicator is the Money Flow Index (MFI).
This is calculated as “a ratio between the total Money Flow over periods having the Typical Price raised, and the total Money Flow over all periods,” according to ThinkorSwim.
I know, I know — pretty convoluted.
BUT, the important thing is that a stock is considered overbought if the MFI goes above 80, suggesting a pullback could be on the horizon.
On the flip side, if the MFI goes below 20, it’s considered an oversold signal, suggesting a stock could bounce.
Sticking to GM, you can see where the MFI flashed an overbought signal just before the April and August tops, and then flashed an oversold signal just before the October lows.
Finally, the Chaikin Money Flow (CMF) oscillator is another indicator you can use.
In relatively simple terms, it is based on volume and an Accumulation/Distribution Line, which assesses the cumulative flow of money into or out of a security.
When the CMF value goes above zero, it’s considered a bullish signal, and vice versa when the CMF value goes negative.
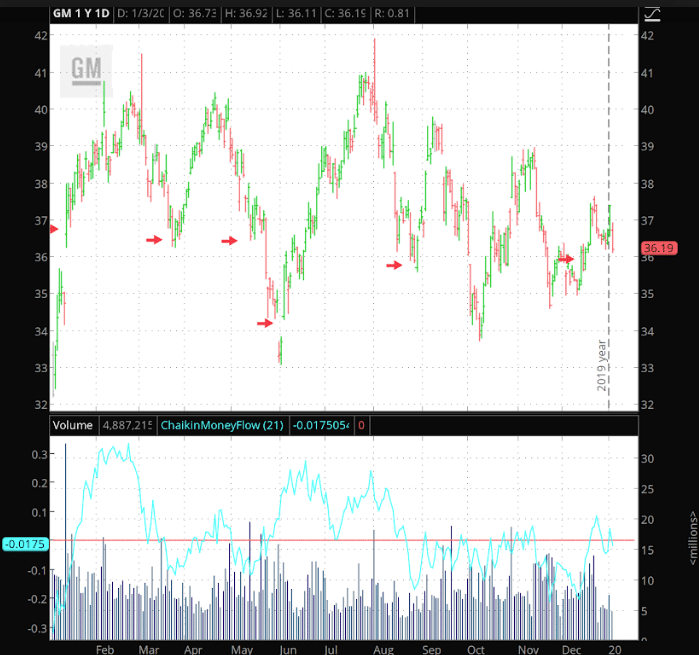
Again using GM as our example, you can see that most previous CMF signals marked notable bottoms for the shares. However, a couple moves below zero — particularly in mid-March and mid-August — didn’t precede major sell-offs, so for this specific stock, at least, the signals seem to be more effective when GM’s CMF goes above zero than when it crosses zero.
In conclusion, there are hundreds (or at least dozens) of volume-based indicators you can use to see how a stock might perform in the future.
However, keep in mind that these should be considered complementary to your fundamental and technical analysis.
Oh, and don’t forget to upgrade to the paid version of Weekly Windfalls before my MasterClass kicks off this month! The class alone is about $1,200.
[Ed. Note: Jason Bond runs
JasonBondPicks.com and TheWeeklyWindfalls.com. In 2015 he earned a 180% return on his money. Then in 2016 he turned a $100,000 account into $430,000! Discover How He Did It]
Source: TheWeeklyWindfalls.com | Original Link
