Well, an amazing storm hit the North East… and it knocked out the power in our area.
I didn’t have a generator, but I was still able to trade from my iPhone in my candlelit home right by the fireplace.
I did catch the SPY trade above $300, although it didn’t close above it.
Many are thinking, “Is it time to buy the dip… or sell the rip?”
Well, it all depends on your outlook:
- Your holding period: is it a few minutes, days weeks or months?
- The overall market conditions, view on politics and the economy?
But to be perfectly honest with you—you only need to focus on chart patterns, catalysts, and value.
Today, I want to do something new — a game of charts (Is it bullish or bearish?)… and by the end of it, you’ll learn exactly how I was able to go 3 for 3 and rake in about $17,000 so far this week (as of yesterday’s close).
Basically, you’ll see the thought process behind these trades, the specific chart setups, and the strategy I used. In addition, I have a recording of a live trading lesson from the other day for you.
Table of Contents
Let’s play a game of charts…
Assuming you know the basics of charts (support and resistance, and a little bit of knowledge on trendlines are all you need), this is going to be pretty fun.
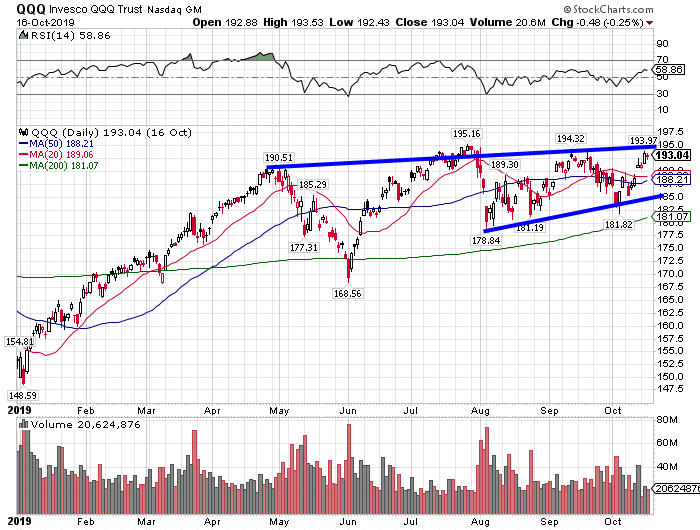
Take a look at this chart in QQQ (the tech tracking ETF)
So this was on Tuesday… and sure, I think the market is going higher… but we got there pretty quick (it was about 5 green days in a row at the time). I’ve been trading long enough that the market just doesn’t go on massive runs without at least some pullbacks.
This is where our game starts.
All you need to know that selling call spreads is bearish and selling put spreads is bullish (and trendlines, resistance).
Basically, I’m selling spreads to improve my odds of success, and take “directional” bets, efficiently. It’s my Weekly Windfalls Strategy, in case you don’t know.
With the way QQQ ran up, I figured it was going to pull back at some point soon.
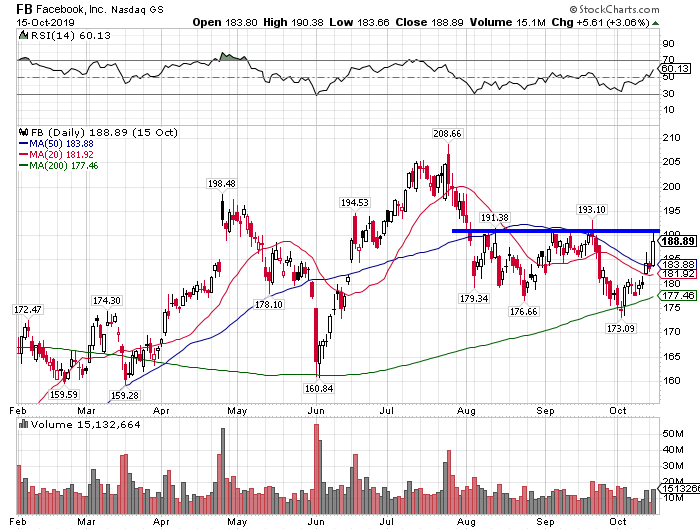
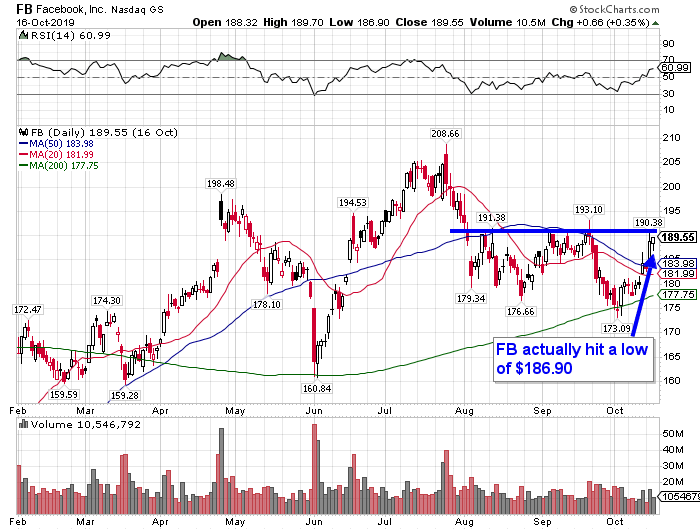
Check out this daily chart in Facebook Inc. (FB). Remember what resistance levels are? If you don’t it’s an area where a stock has a hard time breaking above.
As you can see, $190 was a key level… and I figured there was going to be some selling pressure around there.
So is this bullish or bearish?
To me, over the short-term, it was a bearish signal. FB had a big move on Tuesday when I was setting up the trade… and I figured it was going to just shoot right through $190 because it’s had a tough time there over the past few months.
What strategy did I use?
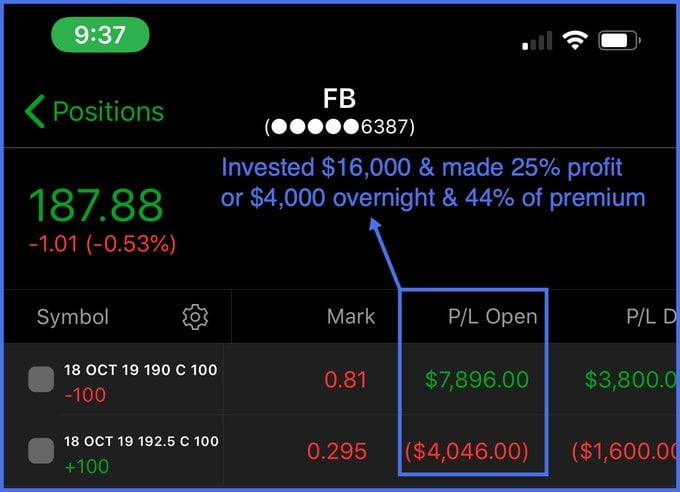
I sold call spreads. This is a bearish trade.
Why?
Whoever buys the call spreads thinks Facebook will stay above $190… but I think it’s going to stay below $190. However, the odds are in my favor.
As time passes, I actually make money (all else being equal) and if implied volatility drops, I also make money. Those are lessons for another day… but just focus on the charts and the spreads.
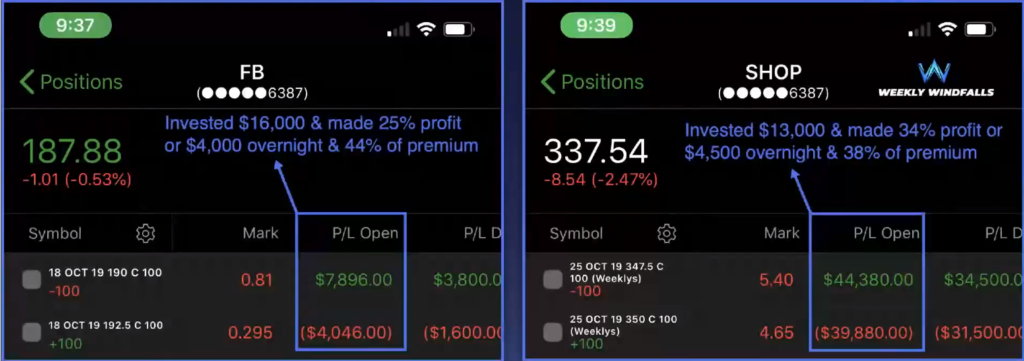
Here’s how that trade turned out.
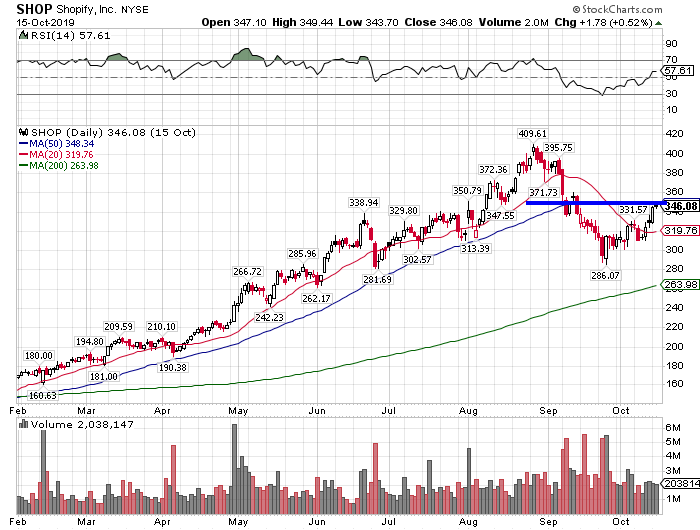
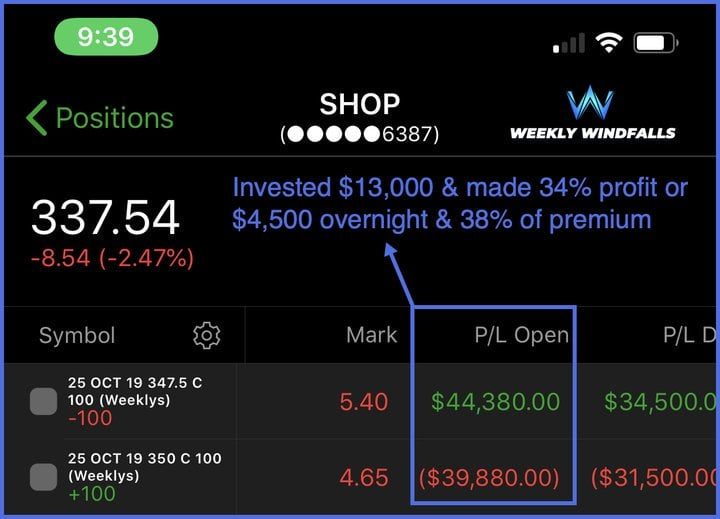
Let’s take a look at my trade in Shopify (SHOP).
Is this bullish or bearish?
Bearish to me.
The blue horizontal line is a key resistance level. Not only that, SHOP made a doji candlestick!
That told me this stock was stalling and it could pull back.
What did I do?
I sold call spreads… again.
Why?
The stock wasn’t moving with the market, there was no upcoming catalyst… so I was comfortable placing this trade.
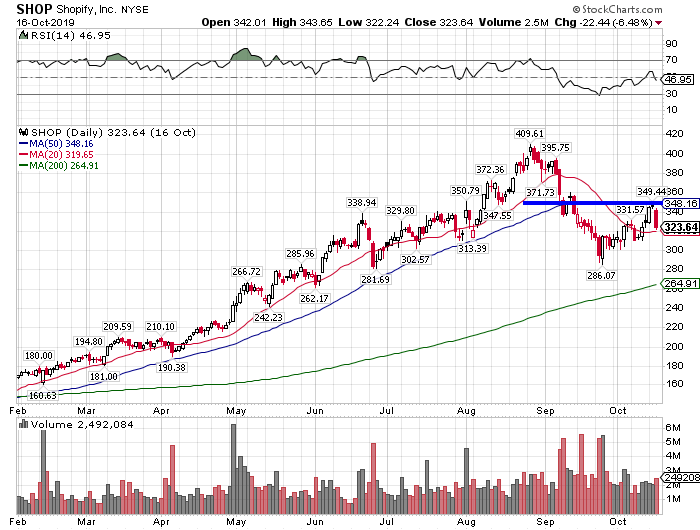
Look at that. The very next day, SHOP drops hard.
I made $8,500 before 10 AM on Wednesday… and that was amazing for me.
But yesterday, I noticed a shift in trend… I placed two bearish bets, but then the market didn’t move as I expected it… so I had to swallow my pride and just move on.
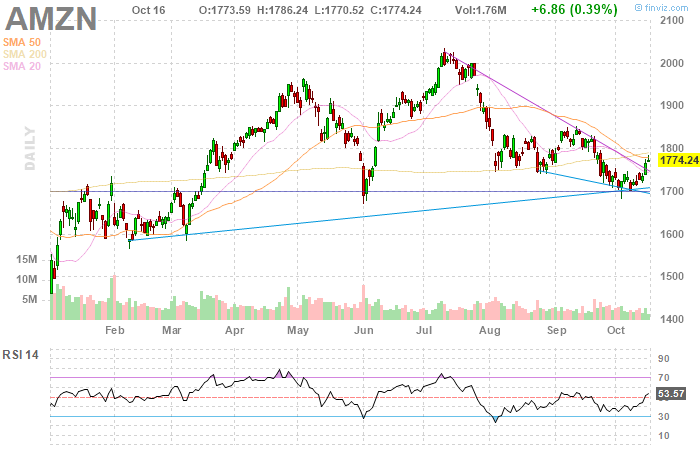
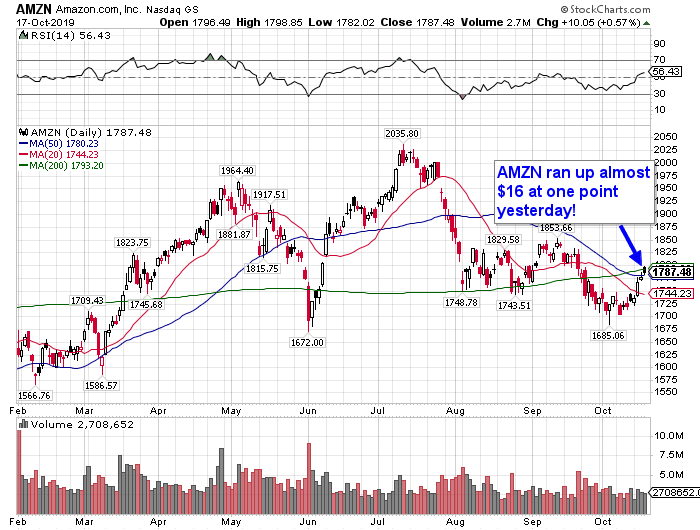
However, I noticed this chart pattern in Amazon.com (AMZN).
AMZN actually broke above a downtrend line…
… now let me ask you, is this bullish or bearish?
Bullish, obviously right?
AMZN is bucking the trend… and actually breaking out of a descending wedge. I figured AMZN would stay above that purple trend line… and $1775 would act as support.
So what did I do?
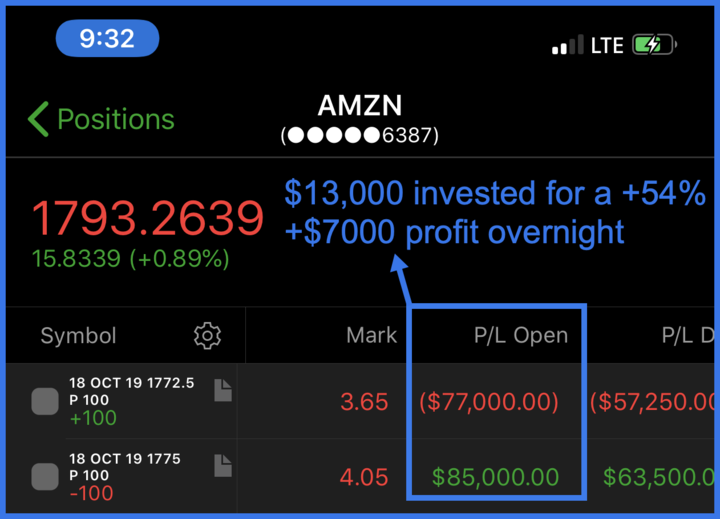
I sold put spreads.
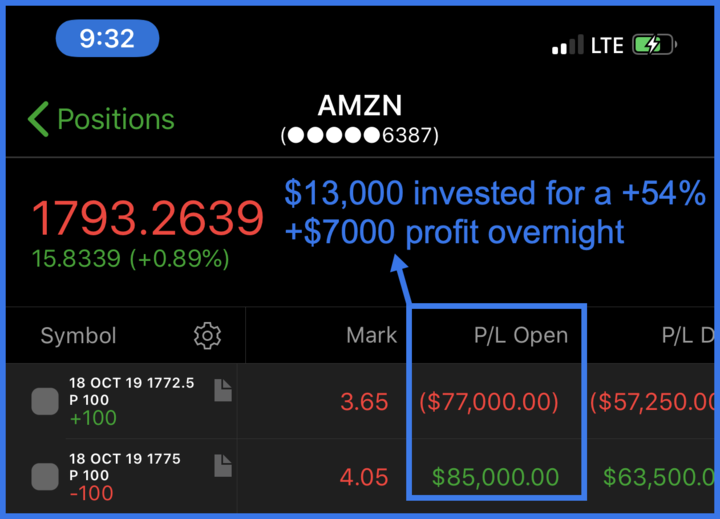
Here’s what happened with AMZN.
The very next day, as I was sitting with my power out… I locked in this 54% winner in AMZN.
If you want to hear more about these trades, watch my Facebook live video from the other day!
[Ed. Note: Jason Bond runs
JasonBondPicks.com and is a swing trader of small-cap stocks. In 2015 he earned a 180% return on his money. Then in 2016 he turned a $100,000 account into $430,000! Discover How He Did It]
Source: JasonBondPicks.com | Original Link
