I’ll start off by saying that I’m not a big fan of indicators. There are far too many of them, and folks rely on them way too often. There’s only a handful of them you can rely on during good and bad times.
For me, it has to be – moving averages.
Everyone from Wall-Street’s biggest honchos to the South Florida retiree drops these guys into their analysis.
However, only the successful ones know exactly how to deploy them for big money.
Here’s a great example from my Total Alpha Portfolio. I used a moving average crossover to score a nice $13,000 profit.

This is the same techniques I talk about in my upcoming masterclass
Most of you are probably familiar with moving averages.
However, I want to drop some insights that will give you a whole new perspective on the topic. Stuff that you can take and immediately apply it to your trading.
Study it, and it will not only make you better, but also more profitable.
Table of Contents
Types of Moving Averages
Moving averages fall into two major categories: simple and exponential.
Yes, there are other categories such as adaptive. However, I’ve never found much use for them and don’t feel they’re worth discussion.
Simple moving averages take the average of a bunch of closing prices over a set period on whatever timeframe you’re using. For example, a 13-period moving average takes the average closing price for the last 13 periods on whatever chart you’re looking at – daily, 15-minute, 1-second, etc.
Exponential moving averages add a weighting to more recent prices than a simple moving average. The amount of weight increases the closer you get to the current price. This creates a much more responsive indicator compared to simple moving averages.
Institutional Moving Averages
Ever wonder what the big boys use on their charts? I’m going to tell you. When I talk about institutions, I’m speaking about funds, not floor traders. We’re talking large amounts of money that takes time to move in and out of trades.
That said, the big funds rely on two major simple moving averages – the 50-period moving average and the 200-period moving average. Big money tends to look at daily and weekly charts.
Ever heard of the death-cross or golden-cross? That’s when the 50-period moving average crosses below/above the 200-period moving average on the daily chart. When they haven’t touched in a while, it’s a signal that the longer-term trend has changed.
We recently saw this pop up on the SPY chart.
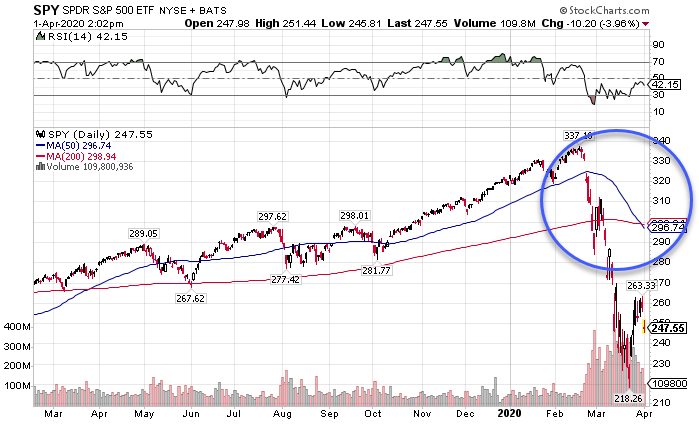
SPY Daily Chart
I guarantee you’ll start hearing about it on television if you haven’t already.
Now, should this matter to you? Heck no! Most funds underperform the market. Take advantage of their stupidity.
Incorporating Moving Averages
No matter which types of moving averages you choose, it’s essential to have a slow and a fast moving average. The fast one should look at a smaller number of periods (somewhere between 5-20) while the slower one should look at a larger number (around 30-60).
Fast-moving averages respond quicker to price changes than the slower ones. When you compare them to the slower moving averages, they indicate the trend is changing. The distance between the two tells you the strength or weakness of the current price action.
The Infamous Money Pattern
Throughout my career, I found one moving average pattern that worked time and again for me. I call this the ‘money pattern.’
The money pattern is pretty simple. First, I start with the hourly chart. Next, I plot the 13-period and 30-period simple moving averages. Then, I look for them to cross when they haven’t touched in a while.
Seems simple enough, right? It can take a little bit of practice. Let’s go back to the SHOP chart from earlier.
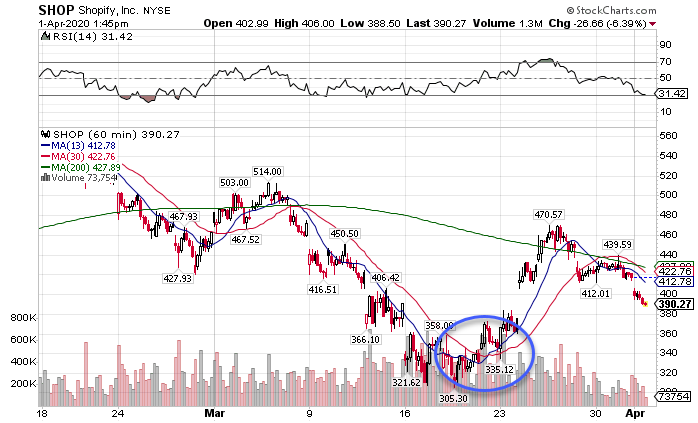
SHOP Hourly Chart
Shopify is an excellent example of the money pattern in action. As the market plunged, so did this stock. Over a couple of days, the stock started to build a base. Then, it launched higher, which brought the 13-period moving average above the 30-period moving average.
Once the stock pulled back into that convergence, I made my move. In order to cap my risk, I sold a put credit spread. That let me decide exactly how much I wanted to risk and my maximum total reward, creating a high probability trade.
Get the best tools and training around
The money pattern is just one of several tools in my arsenal that I readily deploy. In fact, I’ve created a Total Alpha Masterclass to help traders learn these very secrets…for free.
Since we’re all stuck at home, now is a perfect time to enhance your trading without spending a dime.
Click here to sign up for my free options masterclass.
Source: TotalAlphaTrading.com | Original Link