In trading, timing is everything. Having the best idea at the wrong time is the same thing as losing.
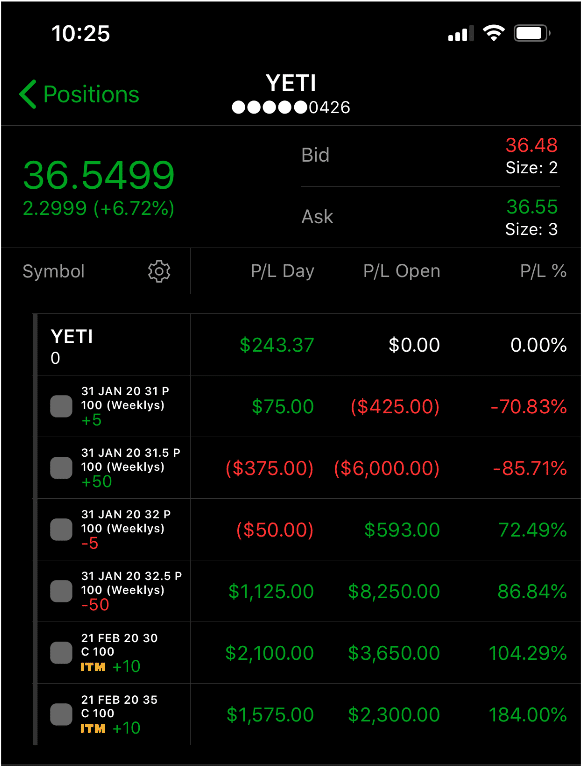
So how did I make millions with my TPS system…the one that perfectly timed this trade in YETI?
What is the secret sauce that my Weekly Money Multiplier Members know?
Quite simply – The Squeeze.
The squeeze was one of the most significant discoveries of my career. It turned me from a breakeven trader into a consistently profitable one.
It identifies when a stock is building up energy through price compression. As the trading range narrows, the closer the stock gets to an explosive move.
Pairing this with options leverages my capital and increases my earnings potential. It’s the very key that helped me turn $38,000 into over $2,000,000 in two years.
This is something you can implement in your trading. It’s much easier than you might think.
Table of Contents
Comparing Bollinger Bands and Keltner Channels
Before we begin, I want to briefly give an overview. Both of these indicators measure some aspect of volatility. They just go about it differently. I’m giving you the setups that I use. However, feel free to play around with your own.
Bollinger Bands
I previously wrote about Bollinger Bands in my weekly newsletter. They’ve become a staple to my trading strategy.
In case you didn’t get a chance to read the article (or as a quick refresher), Bollinger Bands measure two standard deviations of price movement based on a rolling period (most traders use the last 20 periods). Two standard deviations tell you the mathematical range price is expected to land in given the number of bars back selected.
This means that based on the last 20 closes of whatever time frame you’re looking at, there’s a 95% probability price will land within the Bollinger Bands.
It’s important to remember that this is only a probability calculation. Also, it only looks at the close and not the entire candle. You’ll often see price slip through the Bollinger Bands only to bounce back.
Now, as the price range narrows, so do the Bollinger Bands. This tells me price is tightening up relative to its history. But, I need something more to give me a clear sense of timing. That’s where the Keltner Channels come in.
Keltner Channel
Keltner Channels work similar to Bollinger Bands, but with some key differences. First, the centerline is an exponential moving average. The lookback period is the same as the Bollinger Band using the last 20 bars.
It then figures out what’s known as the Average True Range (ATR). This looks back over the same number of periods and for each bar figures out the following:
Maximum amongst:
- Current day High – Low
- The absolute value of the current day high minus the previous close
- The absolute value of the current day low minus the previous close
Lastly, it multiplies it by some value (normally 1.5), then adds and subtracts it to the EMA.
For example, if the 20-period EMA is $100, and the ATR for the same period is $10, then the Keltner Channel would be $100 +/- ($10 x 1.5) = $85-$115.
Unlike Bolinger Bands, the Keltner channel uses an exponential moving average and looks more at the actual trading range history.
So, you’re getting a look at Bollinger Bands that use statistical outputs and Keltner Channels that measure actual trading ranges.
How to Interpret the Squeeze
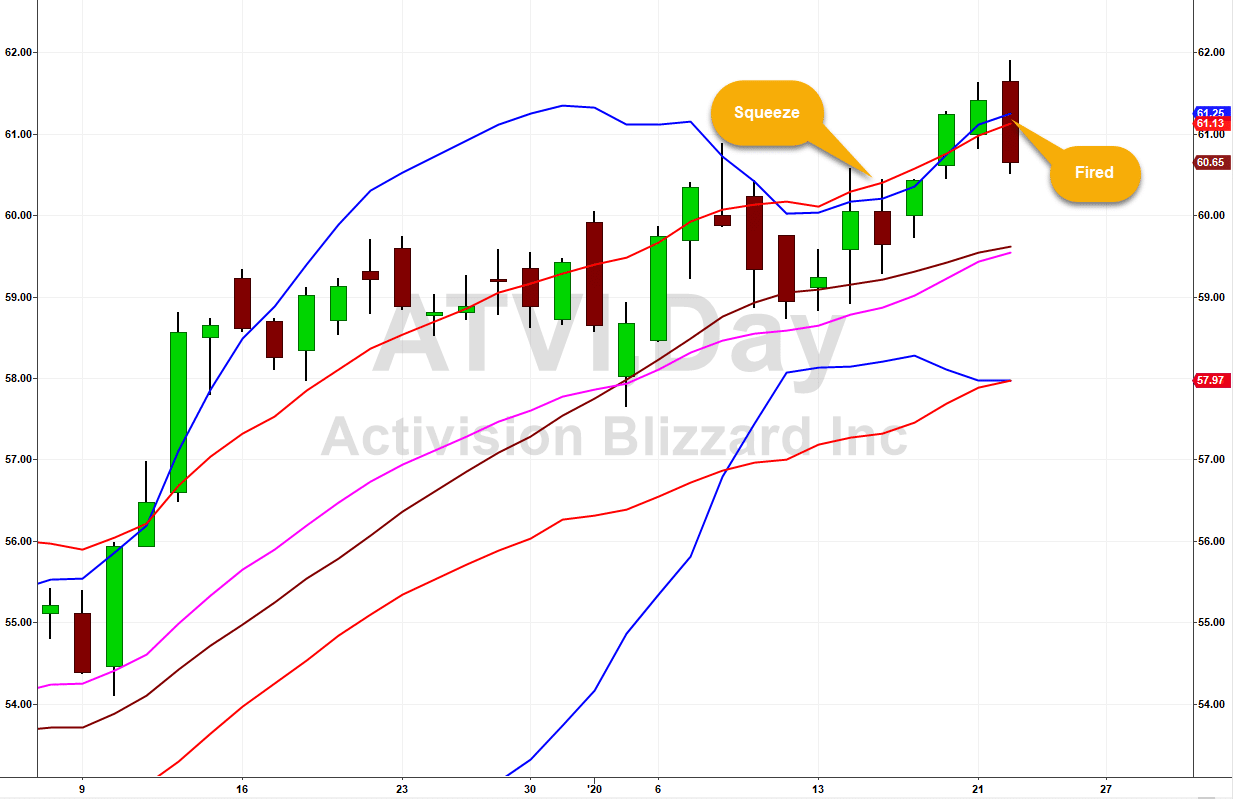
Now for the good stuff. The squeeze occurs when the upper and lower Bollinger Bands trade inside the Keltner Channel. It would look something like this.
What we’re looking at is when statistical outputs say that the trading range is inside what is effectively the actual trading range. It’s like predicting the patriots to score two touchdowns every game when they’ve been consistently scoring 24.
We want to see price then ‘explode’ out of the trading range, where the Bollinger Bands expand outside of the Keltner Channel. This is what we call it when a squeeze ‘fires.’
Playing the Squeeze
The key I found with the squeeze is putting it together with other trading signals. For me, that includes a strong uptrend and a consolidation pattern – hence my TPS setup. I want to enter a trade where all three of these elements are present. Then, I wait for the squeeze to fire.
Most of the time I will play the long side of stocks. That means I look for trades near their highs that look ready to explode higher.
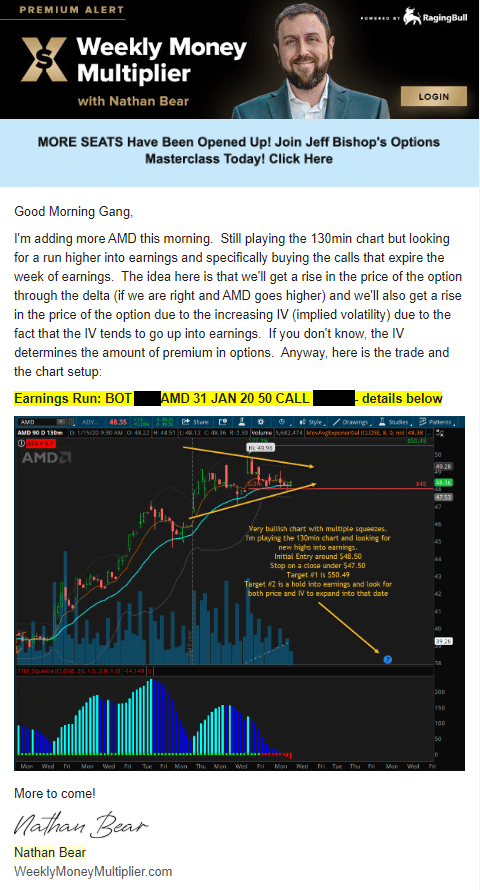
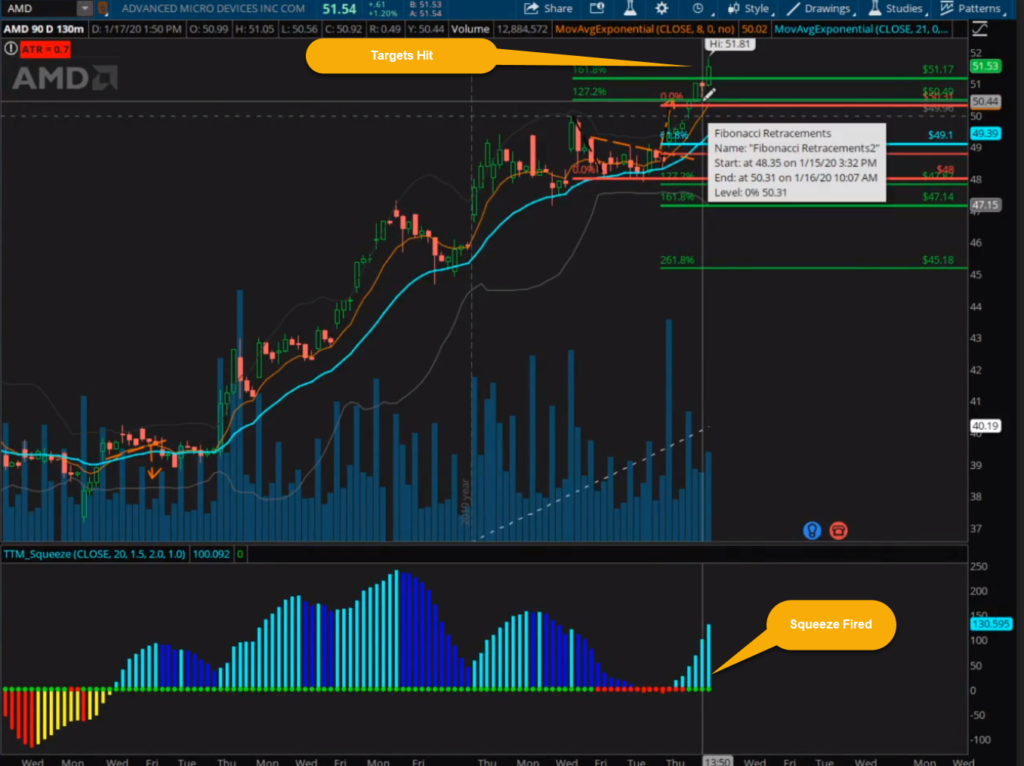
Here’s an example from Weekly Money Multiplier. My setup contained all three elements and a run into earnings.
The red dots at the bottom indicated that the Bollinger Bands were trading inside the Keltner Channel. This gave me confidence the trade would make an explosive move.
When the energy was finally released, it pushed out hard for a whopper of a profit.
Putting It All Together
The trick to becoming a successful trader is combining multiple signals that include timing, price levels, and chart trends. Once you learn these, you’ve got a winning ticket.
It took me a while to put the pieces together. Once I did, it wasn’t long before I turned my $38,000 account into over $2,000,000.
I explain how I accomplished this in my upcoming webinar. You get to learn how I went from losing money to trading for a living.
Source: Weeklymoneymultiplier.com | Original Link


